

 If you didn’t check in on the stock market the last couple of weeks, you might be surprised to see how strong they were this week.
The three major stock indexes — S&P 500 ($SPX), Nasdaq Composite ($COMPQ), and Dow Jones Industrial Average ($INDU) — broke through their 200-day simple moving averages (SMAs) and are about 3–5% away from their all-time highs.
The Dow took a bit of a hit early this week, mostly because shares of UnitedHealth Group, Inc. (UNH) took a tumble. By Friday, though, the Dow recovered.
A Clearer Outlook Ahead
After dealing with an uncertain market, we’re finally seeing some encouraging signs. Large-cap growth stocks are trying to regain the lead, market breadth is improving (i.e. broader participation), and the Cboe Volatility Index ($VIX) has cooled off significantly.
Another helpful signal — the Bullish Percent Index (BPI) — is above 50% for the major indexes. This suggests that bulls are in control. In the 11 S&P sectors, there’s been a switcheroo. Consumer Staples and Utilities now have a BPI below 50%.
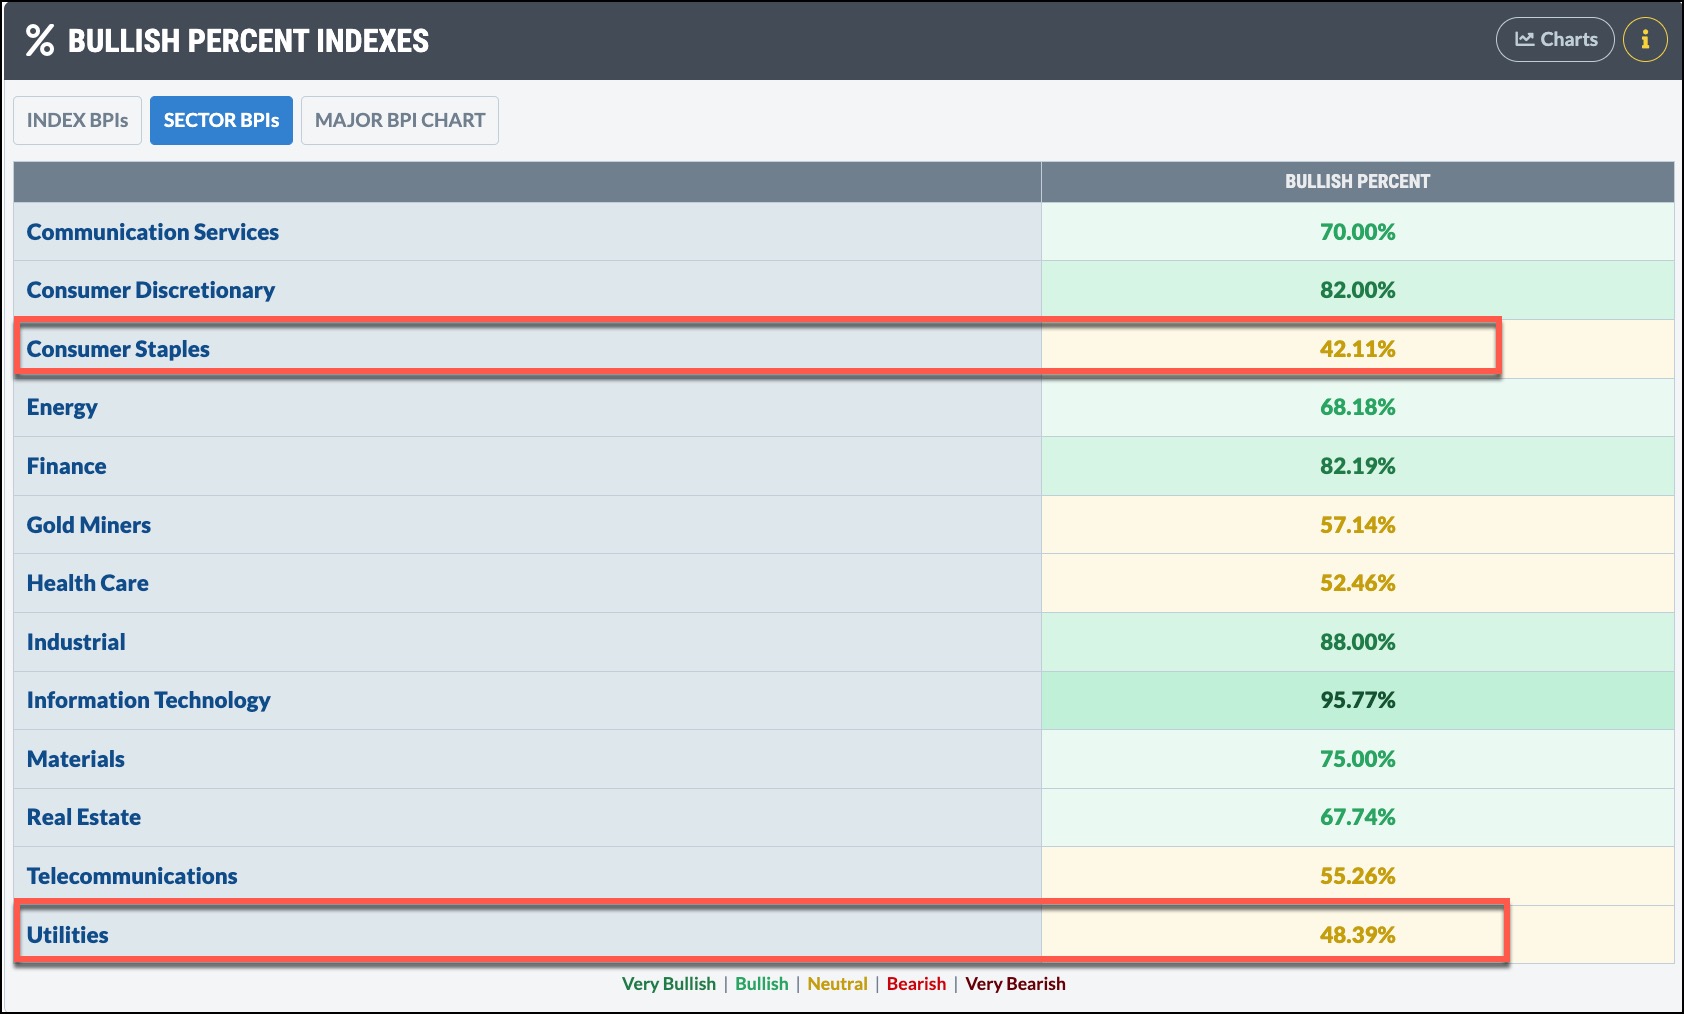
FIGURE 1: BULLISH PERCENT INDEXES FOR THE S&P SECTORS. Consumer Staples and Utilities are below 50%.
Want to dig into this yourself? You can view the full picture on the Market Summary page at StockCharts.com.
Image source: StockCharts.com. For educational purposes.
AI Stocks Back in the Spotlight
If you’ve been following the buzz around artificial intelligence (AI), you know it’s a hot area. This week proved that AI stocks still had their mojo. A mix of headlines, from new global investments in AI to easing tech regulations, gave these stocks a boost.
The VanEck Vectors Semiconductor ETF (SMH) jumped over 10% this week. And NVIDIA Corp. (NVDA), one of the biggest names in AI, surged 16% for the week. The stock is now trading above its 200-day SMA and approaching its February high, which could act as a resistance level. This is the first time NVDA’s stock price broke above its 200-day SMA after breaking below it on February 27.
Other big names like Broadcom Inc. (AVGO) and Taiwan Semiconductor Mfg. (TSM) also saw solid gains.
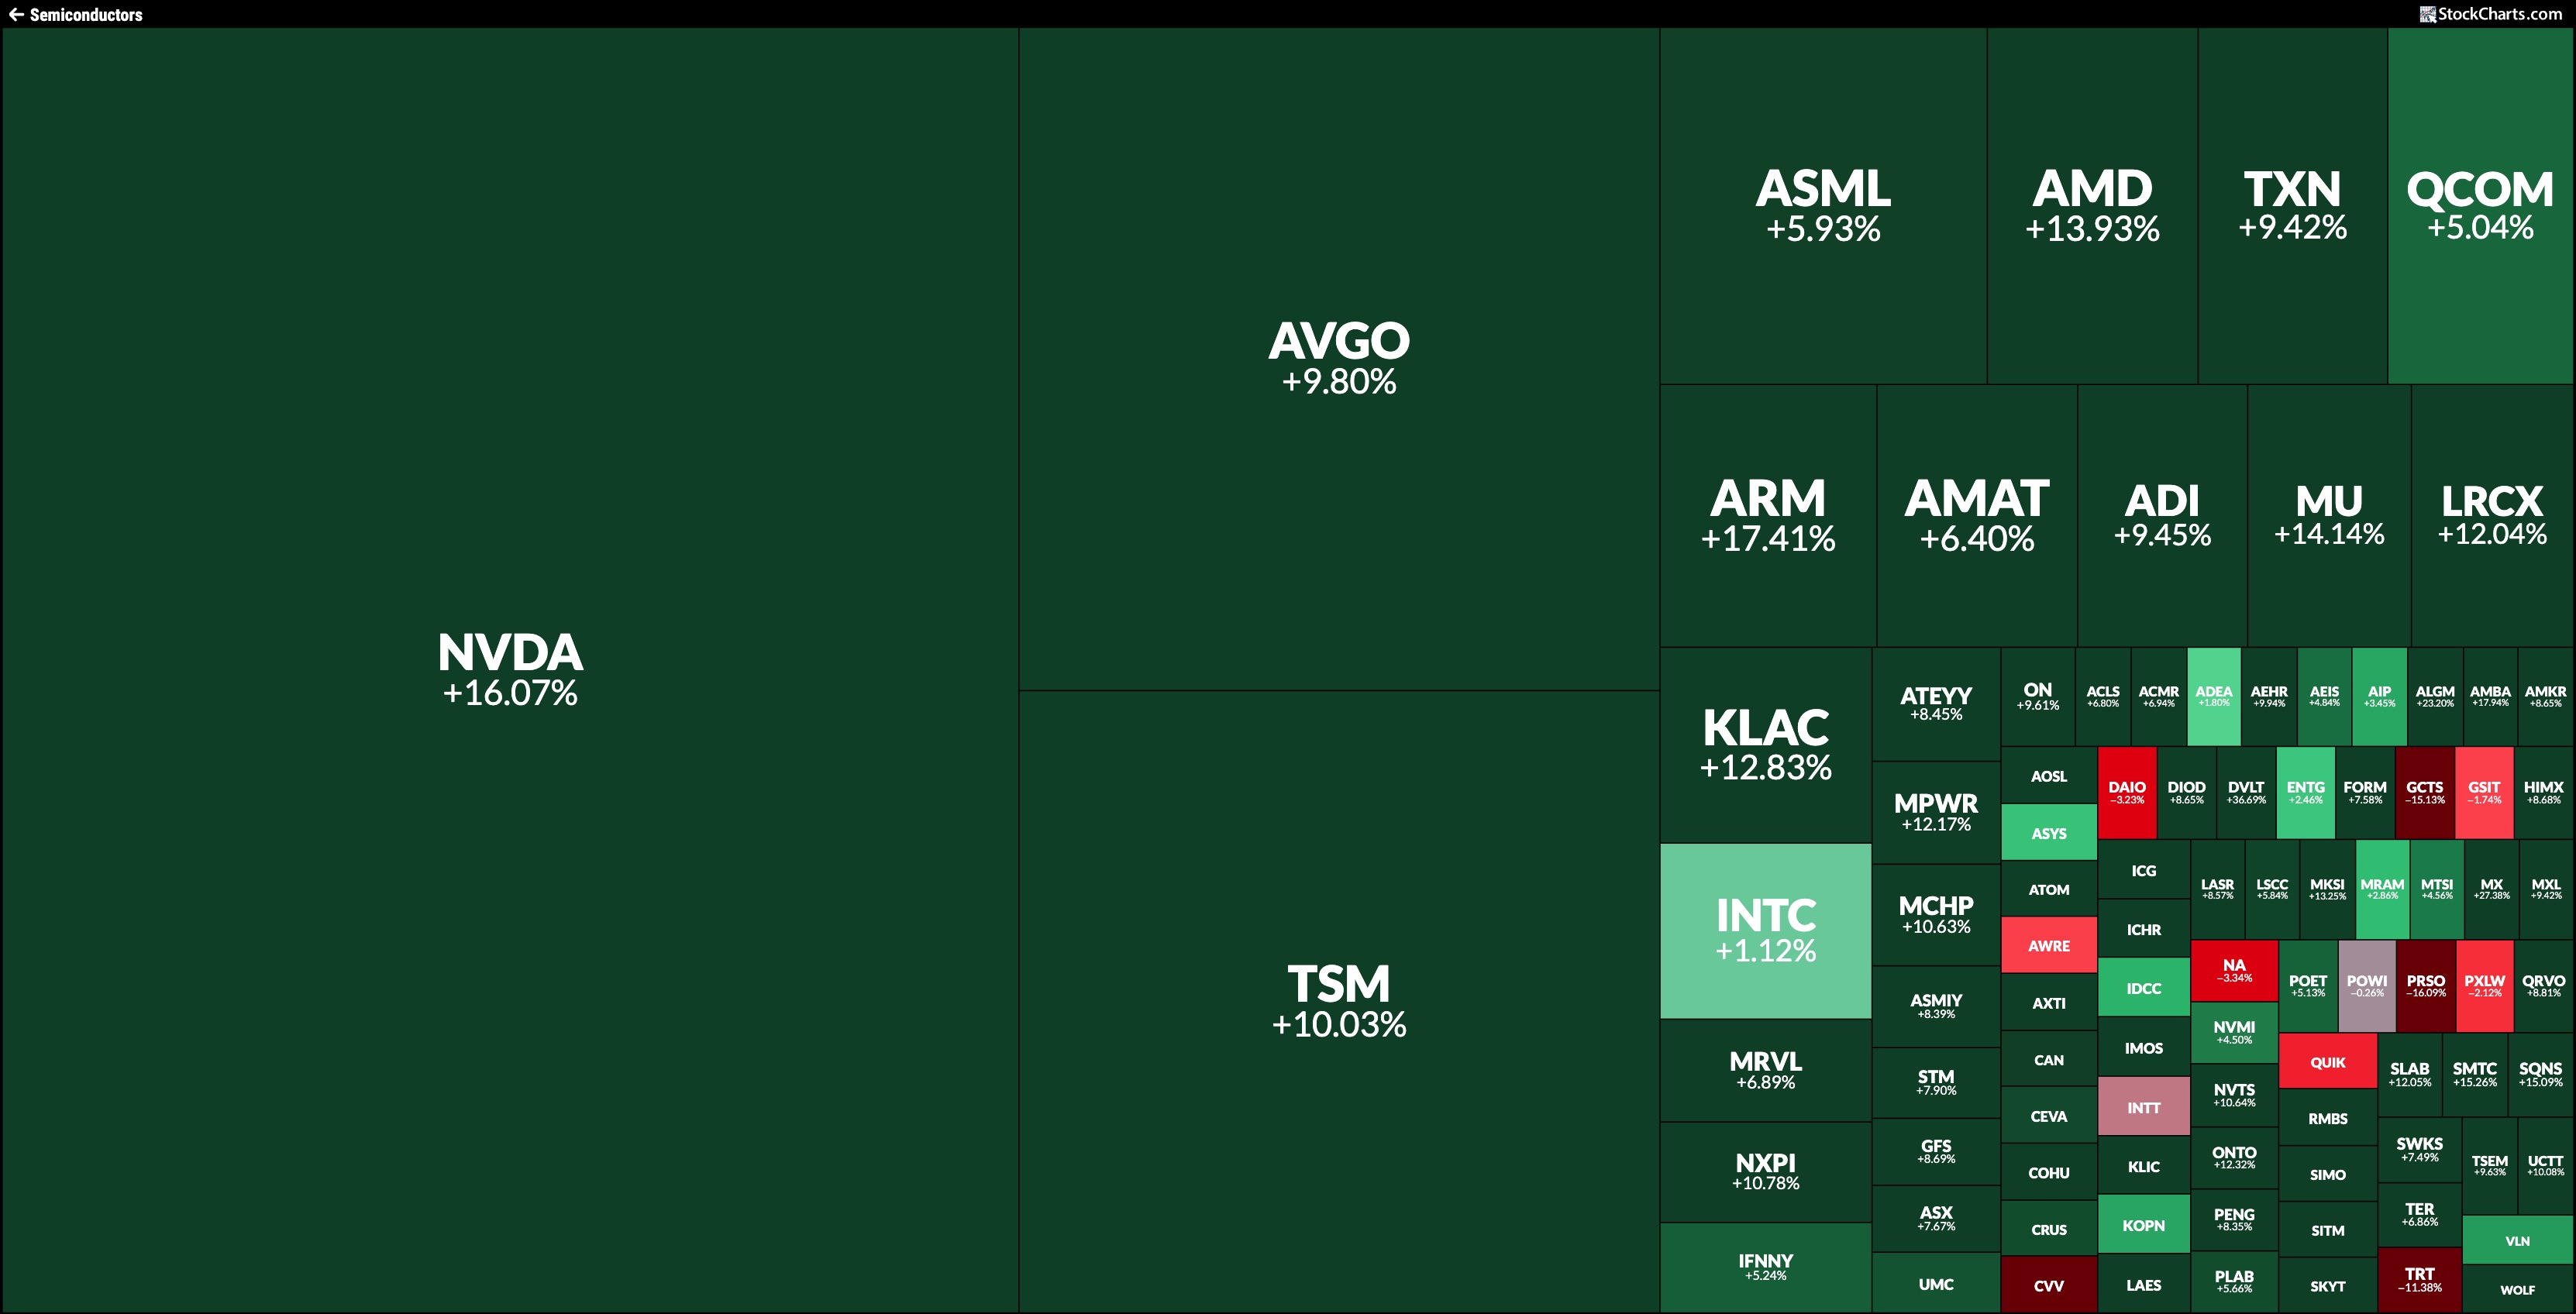
FIGURE 2. SEMICONDUCTORS MARKETCARPET. Note that NVDA, AVGO, and TSM saw strong gains this week.Image source: StockCharts.com. For educational purposes.
Investors Turning Toward “Offense”
Investors are rotating into offensive sectors such as Technology and Consumer Discretionary and moving away from traditionally “safe” areas like Utilities and Staples. This is an indication that investors are feeling more confident.
News of lower tariffs between the U.S. and China has eased fears, which is reflected in the performance of bellwether industries such as Home Builders, Transportation, and Retail. The SPDR S&P Retail ETF (XRT) took a big hit on the possibility of high tariffs but bounced in early April. This week, the ETF gapped up and is now trading above its 200-day SMA (see chart below).
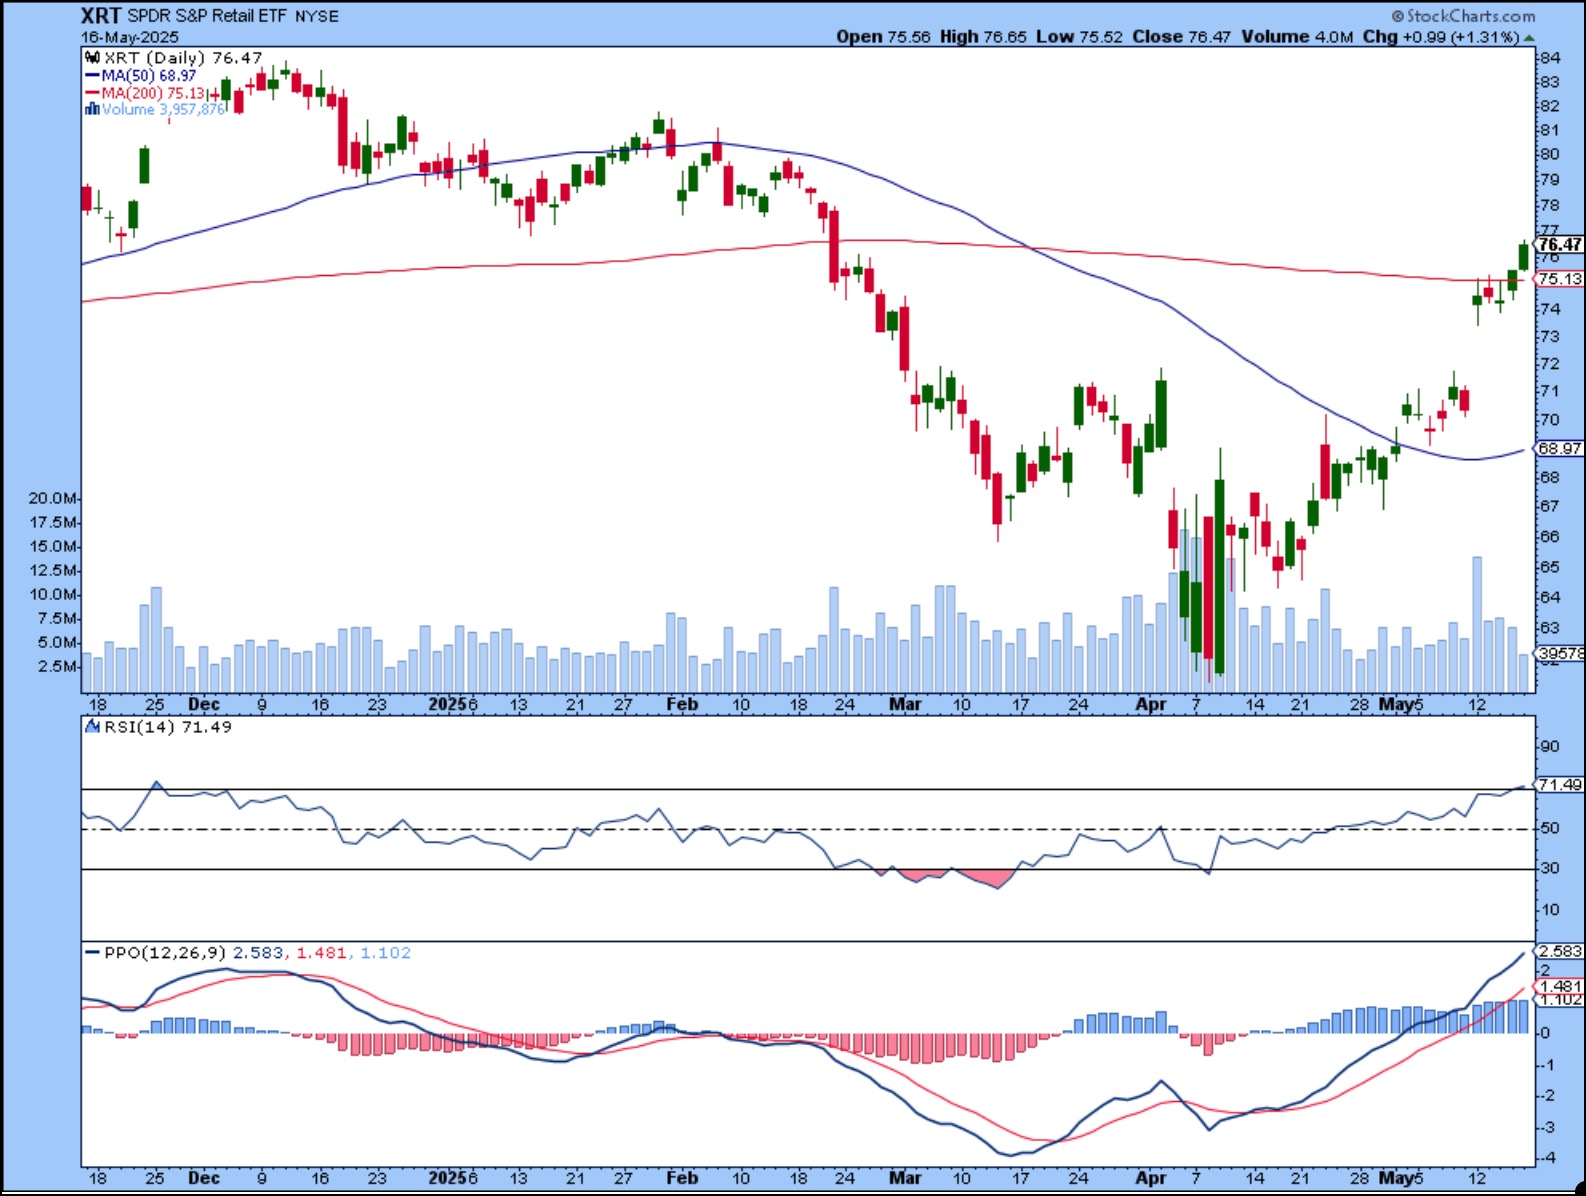
FIGURE 3. DAILY CHART OF SPDR S&P RETAIL ETF (XRT). After getting hammered, XRT is showing signs of recovery. The stock is now gaining some traction. It’s trading above its 200-day SMA, and momentum is strengthening.Chart source: StockCharts.com. For educational purposes.
XRT’s relative strength index (RSI) is rising above 70 and the percentage price oscillator (PPO) is well above zero. Both indicators suggest a rise in momentum.
A Word of Caution: Consumers Are Still Nervous
Amidst the excitement, we can’t ignore one concerning signal: consumer sentiment.. The latest reading of the University of Michigan’s consumer sentiment index came in at 50.8, which is pretty close to the June 2022 reading of 50, when inflation was over 9%.
Results showed that consumers are worried about inflation — the expectation was a high 7.3%. Walmart (WMT) executives even mentioned during its recent earnings call that higher tariffs might lead to price increases. This is something to keep in the back of your mind because, when consumer sentiment weakens, it could ripple through the stock market.
Inflation expectations are starting to climb higher. The probability of the interest rate cuts has dropped, according to the CME FedWatch tool. Cuts in June and July are off the table now. The chart below is worth adding to one of your ChartLists.
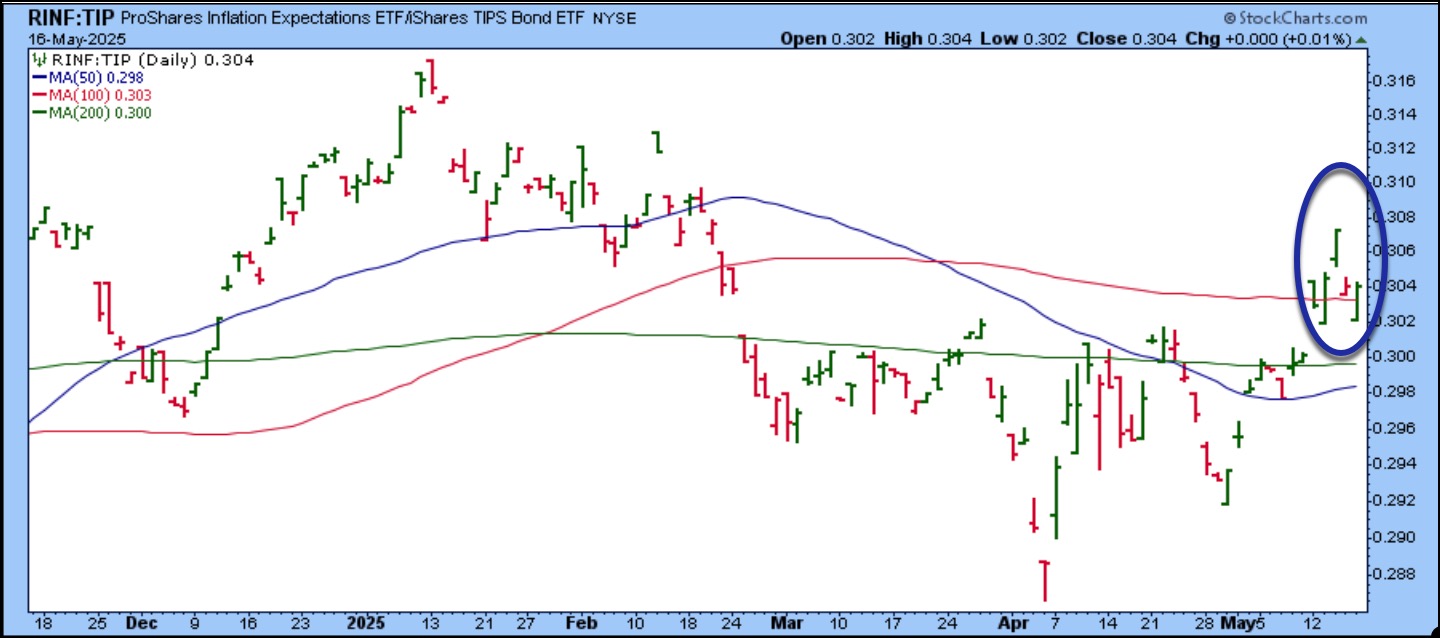
FIGURE 4: INFLATION EXPECTATIONS ARE CREEPING HIGHER. It’s worth monitoring this chart because higher prices lead to less consumer spending and declining consumer confidence. This can be a headwind for equity markets.Chart source: StockCharts.com. For educational purposes.
The Bottom Line
When the stock market reverses course as quickly as it did this week, it doesn’t hurt to be skeptical. Before getting caught up in the euphoria, keep an eye on things like offensive vs defensive sector rotation, market breadth indicators, and key fundamentals such as inflation expectations. If inflation heats up again, the Fed will be reluctant to cut interest rates. This is the kind of thing that can put the brakes on a market rally.
End-of-Week Wrap-Up
- Dow Jones Industrial Average: 42,654 (+ 3.41%)
- S&P 500: 5,958.38 (+ 5.27%)
- Nasdaq Composite: 19,211 (+7.15%)
- $VIX: 17.24 (-21.28%)
- Best performing sector for the week: Technology
- Worst performing sector for the week: Health Care
- Top 5 Large Cap SCTR stocks: Palantir Technologies, Inc. (PLTR); Nebius Group NV (NBIS); NRG Energy, Inc. (NRG); Robinhood Markets Inc. (HOOD); Super Micro Computer, Inc. (SMCI)
On the Radar Next Week
- May PMI Flash
- April Existing Home Sales
- Earnings from Home Depot (HD), Lowe’s Companies (LOW), Toll Brothers, Inc. (TOL), XPeng Inc. (XPEV), Snowflake (SNOW), Baidu Inc. (BIDU), and several others.
- Fed speeches from Bostic, Jefferson, Williams, and others.

Disclaimer: This blog is for educational purposes only and should not be construed as financial advice. The ideas and strategies should never be used without first assessing your own personal and financial situation, or without consulting a financial professional.